The music industry in 2026 stands at a crossroads where traditional promotional tactics are rapidly giving way to a new era of data-driven decision-making. The difference between a successful campaign and a financial drain now lies in understanding the nuanced return on investment (ROI) provided by various digital platforms. While the global recorded music industry continues its growth trajectory, with streaming accounting for a significant portion of revenue, the battle for listener attention has intensified to an unprecedented level . Artists, labels, and marketers must now navigate a complex ecosystem where audience attention is fragmented, algorithms dictate visibility, and every advertising dollar must be meticulously justified.
This comprehensive analysis delves into the core marketing ROI metrics, platform benchmarks, and strategic shifts that are defining success in the music industry this year. We will explore the end of Meta’s advertising monopoly, the rising dominance of TikTok, the resurgence of email marketing, and the sophisticated financial models that allow savvy marketers to measure and optimize their campaigns effectively.
The Shifting Sands of Music Advertising Budgets
For years, Meta (Facebook and Instagram) has been the undisputed king of music marketing budgets, serving as the default platform for driving traffic and conversions. However, the landscape is fundamentally shifting. According to recent data, while Meta still holds a commanding 74% of music ad budgets in 2026, its stranglehold on the market is beginning to weaken .
The primary driver of this shift is the meteoric rise of TikTok, which has doubled its share of music ad budgets over the past two years to 12.2% . This reallocation is not merely a trend but a response to tangible economic advantages. The data reveals that an average Meta campaign delivers approximately 3.1 million impressions per €10,000 spent, whereas TikTok delivers an impressive 8.5 million impressions for the same budget . This makes TikTok 2.7 times cheaper for generating impressions, a critical metric in the attention economy. Beyond the platforms themselves, there is a broader reallocation of marketing spend. Traditional expenditures on radio, press, and lengthy artist development are shrinking, with budgets moving toward platforms and environments that can guarantee daily attention, such as live streaming ecosystems and creator networks . Money has not disappeared from the industry; it has simply moved to where the audience’s attention lives .
Platform-by-Platform ROI Benchmarks for 2026
To maximize ROI, marketers must understand the specific performance metrics and costs associated with each major platform. These benchmarks serve as a starting point for campaign planning and should be refined with first-party data over time.
-
Meta (Facebook & Instagram): Despite losing some market share, Meta remains a powerhouse for driving conversions and retargeting. In Tier 1 markets (US, UK, Canada, Australia), the cost per save (CPS) can range from $2.51 to $4.70, with CPMs soaring between $23 and $77 . However, in Tier 2 markets (Latin America, Southeast Asia), these costs plummet, with CPS ranging from $0.24 to $2.40 and CPMs from $2 to $9. This massive disparity underscores the importance of geo-targeting in budget efficiency. For broader campaigns, Meta’s CPM typically ranges from $8 to $25, with a CPC of $0.40 to $1.50 .
-
TikTok: TikTok’s value proposition extends beyond its lower cost for impressions. Its native, short-form, sound-on creative format drives a significant CPM advantage, with costs typically between $4 and $15 . Its unique “Spark Ads” allow marketers to amplify existing organic posts, consolidating engagement metrics like views, comments, and shares to a single post rather than a separate ad entity . This provides a powerful boost to social proof. TikTok has demonstrated effectiveness in converting discovery into streaming momentum, often serving as the catalyst for songs to break into charts .
-
YouTube: YouTube offers distinct ad formats tailored to different campaign goals. Skippable in-stream ads are cheaper at $0.02 to $0.10 per view (CPV) and are best for broad reach when there is a strong opening hook. In-feed ads, which appear in search results and suggestions, are more expensive ($0.10 to $0.30 CPV) but drive higher-intent traffic from users actively browsing content . YouTube also offers a critical advantage for long-term ROI: its Art Tracks and Content ID generate a healthy $5.28 RPM (revenue per thousand streams), which can partially offset campaign costs .
-
Spotify: Spotify’s native advertising tools are designed for different stages of the listener funnel. Marquee is a full-screen recommendation that targets lapsed listeners of an artist, and it’s claimed to be up to 10 times more efficient per dollar than social media ads for re-engagement . However, it requires eligibility thresholds of 1,000 streams in the past 28 days and 5,000 monthly active listeners. Its budgets range from $100 to $10,000, and starting in February 2026, all display campaigns will deliver over a full period (about 10 days for Marquee) for sustained momentum . Spotify Ads Manager, on the other hand, allows for audio and video ads to the platform’s free-tier users, with a minimum budget of about $250 .
Critical Key Performance Indicators and Funnel Metrics
Understanding the metrics at each stage of the marketing funnel is essential for diagnosing campaign health and optimizing performance. The following table provides a structured view of the key performance indicators (KPIs) and their conservative benchmarks for 2026 .
| Funnel Stage | Primary Metric | Conservative Working Range | What “Good” Usually Means |
|---|---|---|---|
| Awareness | CPM (Cost Per Mille) | $5 – $20 | Stable reach is achieved without causing audience fatigue from overexposure. |
| Consideration | CPC / CPV (Cost Per Click / View) | $0.30 – $1.50 (click) / $0.02 – $0.10 (view) | The creative is engaging enough to retain attention and qualify the traffic for further action. |
| Conversion | Cost Per Save | $0.30 – $1.20 | The primary conversion event (e.g., saving a track) shows economic viability. |
| Retention | 7-Day Repeat Rate | 15% – 35% | New listeners are organically returning to the artist’s catalog without heavy ad support. |
It is crucial to avoid the common pitfall of optimizing for a low CPM while ignoring downstream conversion rates. A low CPM with weak conversion is often a hidden loss . Marketers should view all metrics holistically, using a combination of top-of-funnel reach and bottom-of-funnel action to gauge true campaign effectiveness.
A, B, C, D: Four Strategic Guidelines for Maximizing ROI
Based on the data and industry analysis for 2026, the following sequential guidelines offer a practical framework for campaign execution.
A. Start with First-Party Data: The single most effective lever for improving advertising efficiency is the use of first-party audiences. Utilizing data such as email lists or past website visitors can cut your cost per sale by 30.4% on Meta platforms . Building an owned audience through an email list is also one of the highest-ROI activities, generating $36 for every $1 spent, outperforming both Google Ads (~$7) and social media ads (~$2.50) .
B. Audit Platform Performance Using Cost Per Sale: For live events, track the Cost Per Ticket Sold (CPTS) meticulously. This is calculated by dividing the total marketing spend on a channel by the number of tickets attributed to that channel . For recorded music, the “Cost Per Save” serves as a critical bridge metric between awareness and actual consumption . A cost per save under $0.50 usually signals strong campaign economics, while anything over $1.50 is generally inefficient .
C. Strategically Allocate Budget by Goal: Avoid splitting a small budget across multiple platforms. For the first $500, allocate 80% to your primary platform and 20% to a secondary test to generate clean, actionable data. The platform choice should match your primary goal:
-
For Spotify Saves: Meta combined with a smart link is the primary driver for new discovery, while Spotify’s Marquee is effective for reactivating known listeners .
-
For Video Views: YouTube in-feed or in-stream ads offer scalable reach with measurable engagement .
-
For Social Proof: TikTok Spark Ads amplify organic engagement and build visible momentum .
D. Validate and Optimize with Royalty Data: The ultimate ROI question is whether the royalties generated by acquired listeners offset the ad spend. A worked example shows that a $500 Meta campaign achieving a $0.75 cost per save can generate 667 saves. If each saver generates 150 streams over 12 months, the total streams would be 100,050. The royalty revenue generated from this can then be directly compared against the ad spend to calculate the net profit or loss of the campaign . This long-term view is essential for sustainable marketing.
Analyzing Different Campaign Scenarios
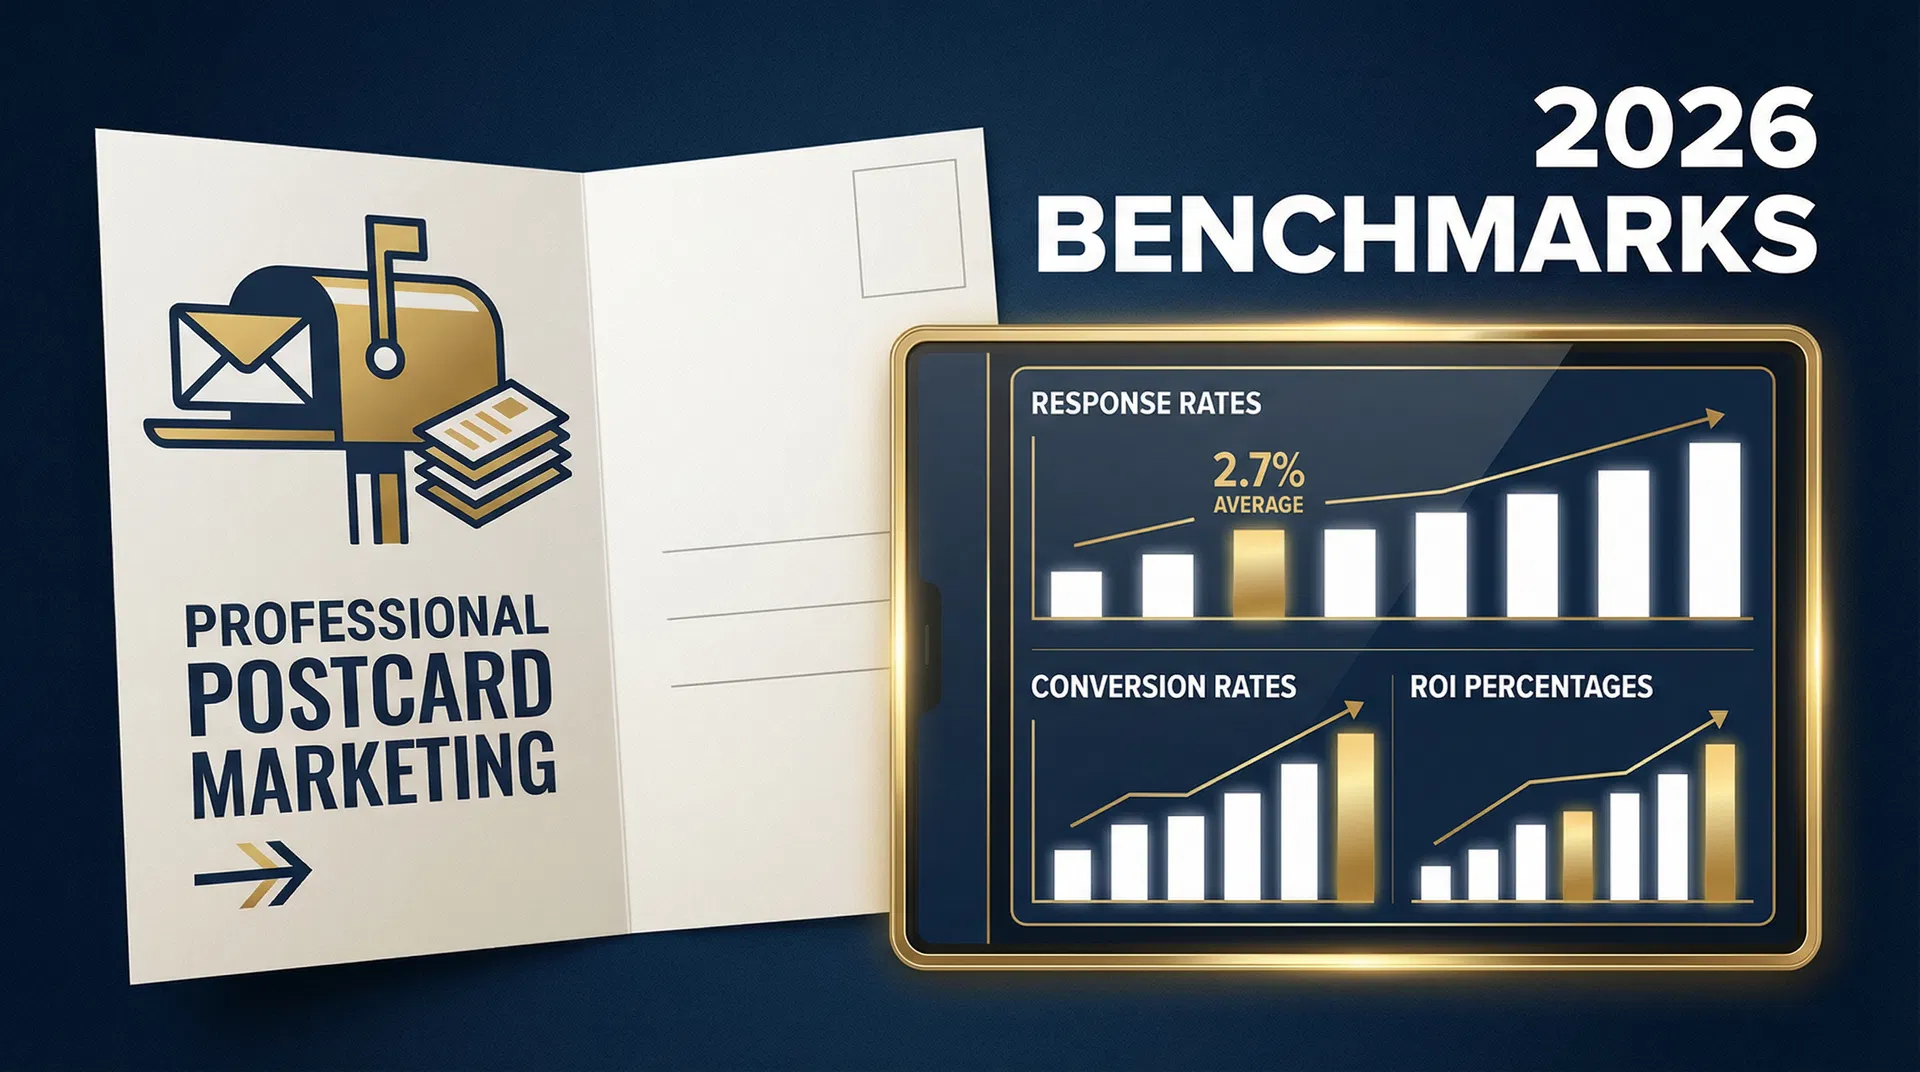
The data reveals that different creative and targeting scenarios require specific fixes .
-
Scenario 1: Strong Views, Weak Saves. The marketing creative is effective at generating awareness, but it fails to convert viewers into taking action. The solution lies in fixing the bridge between the ad and the conversion point. This often means improving the landing page flow, clarifying the call-to-action (CTA), and ensuring the link to the save page is prominent and easy to use.
-
Scenario 2: Decent Saves, Weak Repeat Listeners. The campaign is effective at generating a first action (a save), but these new listeners are not returning to the artist’s profile or catalog. The issue is one of retention. The artist should work on improving the post-save experience, such as creating a more compelling artist profile or planning a sequence of engaging content for after the release.
-
Scenario 3: Good Conversion in One Territory Only. The campaign is efficient in one specific geographic area, but underperforms elsewhere. The worst thing to do is to flatten the budget globally. Instead, split the winning markets into dedicated campaigns and scale the budget where the economics are already proven.
A Practical ROI Model and Reporting Template
To move beyond anecdotal evidence and make data-driven decisions, a structured reporting framework is indispensable. The following table provides a template for stakeholders to quickly assess campaign performance .
| KPI | Target Band | Current | Direction | Decision |
|---|---|---|---|---|
| CPM | $5 – $20 | … | ↑ / ↓ / ↔ | … |
| CPC / CPV | Channel-Dependent | … | ↑ / ↓ / ↔ | … |
| Cost Per Save | $0.30 – $1.20 | … | ↑ / ↓ / ↔ | … |
| Follow Rate | Campaign-Specific | … | ↑ / ↓ / ↔ | … |
| 7-Day Repeat Rate | 15% – 35% | … | ↑ / ↓ / ↔ | … |
The “Decision” column is the most critical element of this template. Reporting that does not trigger an action—whether that is scaling a winning campaign, pausing an ineffective one, or refreshing a creative—is merely noise .
Conclusion
The music industry marketing landscape of 2026 is one of immense opportunity for those armed with the right data. The era of relying on a single platform or a “post and pray” approach is definitively over. The data shows that while Meta remains a giant, its dominance is eroding as TikTok offers a cheaper and more engaging path to discovery for a fraction of the cost .
Success now hinges on a sophisticated, multi-pronged strategy: building owned audiences to reduce acquisition costs, meticulously tracking metrics like Cost Per Save and 7-Day Repeat Rate, and understanding the unique economic model where streaming royalties can offset advertising spend. By following the strategic guidelines outlined in this blueprint and using benchmarks to inform decisions, artists and marketers can transform their campaigns from a cost center into a powerful, measurable engine for growth and sustainability in the modern music business.